35 years revolutionizing the present with technology.
Trusted by CIOs, CTOs, and business owners from over 1.000 clients around the world.
We lead technological change with our clients.


Our global footprint
We have successfully executed projects in more than
50 countries.
DevSecOps.
Software development has evolved in recent years to foster collaboration between development, security, and operations teams.
SUCCESS STORY
Servicios Funerarios de Madrid. Modernization of its IT infrastructure.
View Success StoryIndustries we serve
We have a robust presence across different industries, delivering advanced technological solutions that optimize operational efficiency and foster the growth of our clients.
Publications
Discover the world of knowledge.
Technology is advancing at a breathtaking pace. At Satec, we adapt to the rhythm of these changes, integrating innovations into our value proposition to put them at the service of our clients.
Go to Blog
How does intelligent data management revolutionize business decision-making?
23 OCT, 2024 • 1 min

SATEC and its Patronage: Supporting El León de Oro Choir to Inspire Excellence
9 OCT, 2024 • 3 min
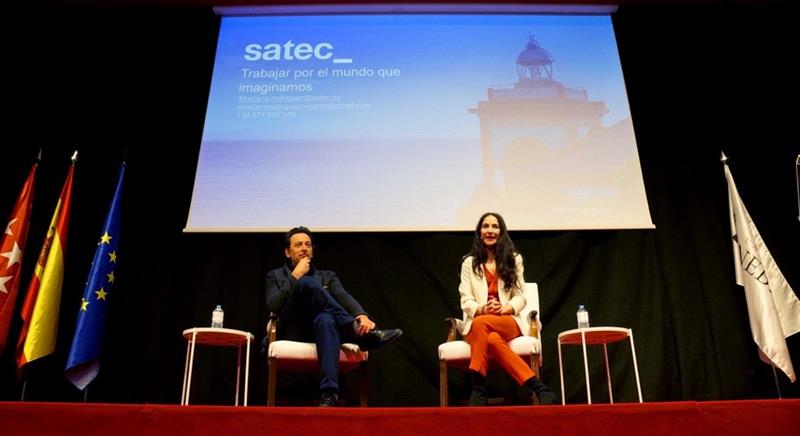
FEDA Award: Montaña Rodríguez-Ovejero, “Executive Woman 2024”
30 SEP, 2024 • 3 min

SATEC Awards Prizes to the Winners of its 2nd Hackathon
23 SEP, 2024 • 1 min

Stay connected.
Leave us your email, and we will keep you updated on news, events, and important announcements. No spam, only what truly matters.